Project controlling, analyzing and monitoring projects
Project controlling in Octaved Flow is organized thematically. The menu items are based on the user's information requirements. This means that you first select the menu item on which topic you would like to find out more, get an overview there and then go into more detail via, for example, project folders, projects, sub-projects or work packages. The combination with filters enables vertical and horizontal analyses.
In work/finished
The In Progress/Finished menu item offers a helicopter perspective on projects and provides answers to elementary questions such as: How many work packages have been started, not yet started, or are finished? Which people are involved in the project? How much time has been booked on the project? Have due dates been exceeded and if so, which ones?
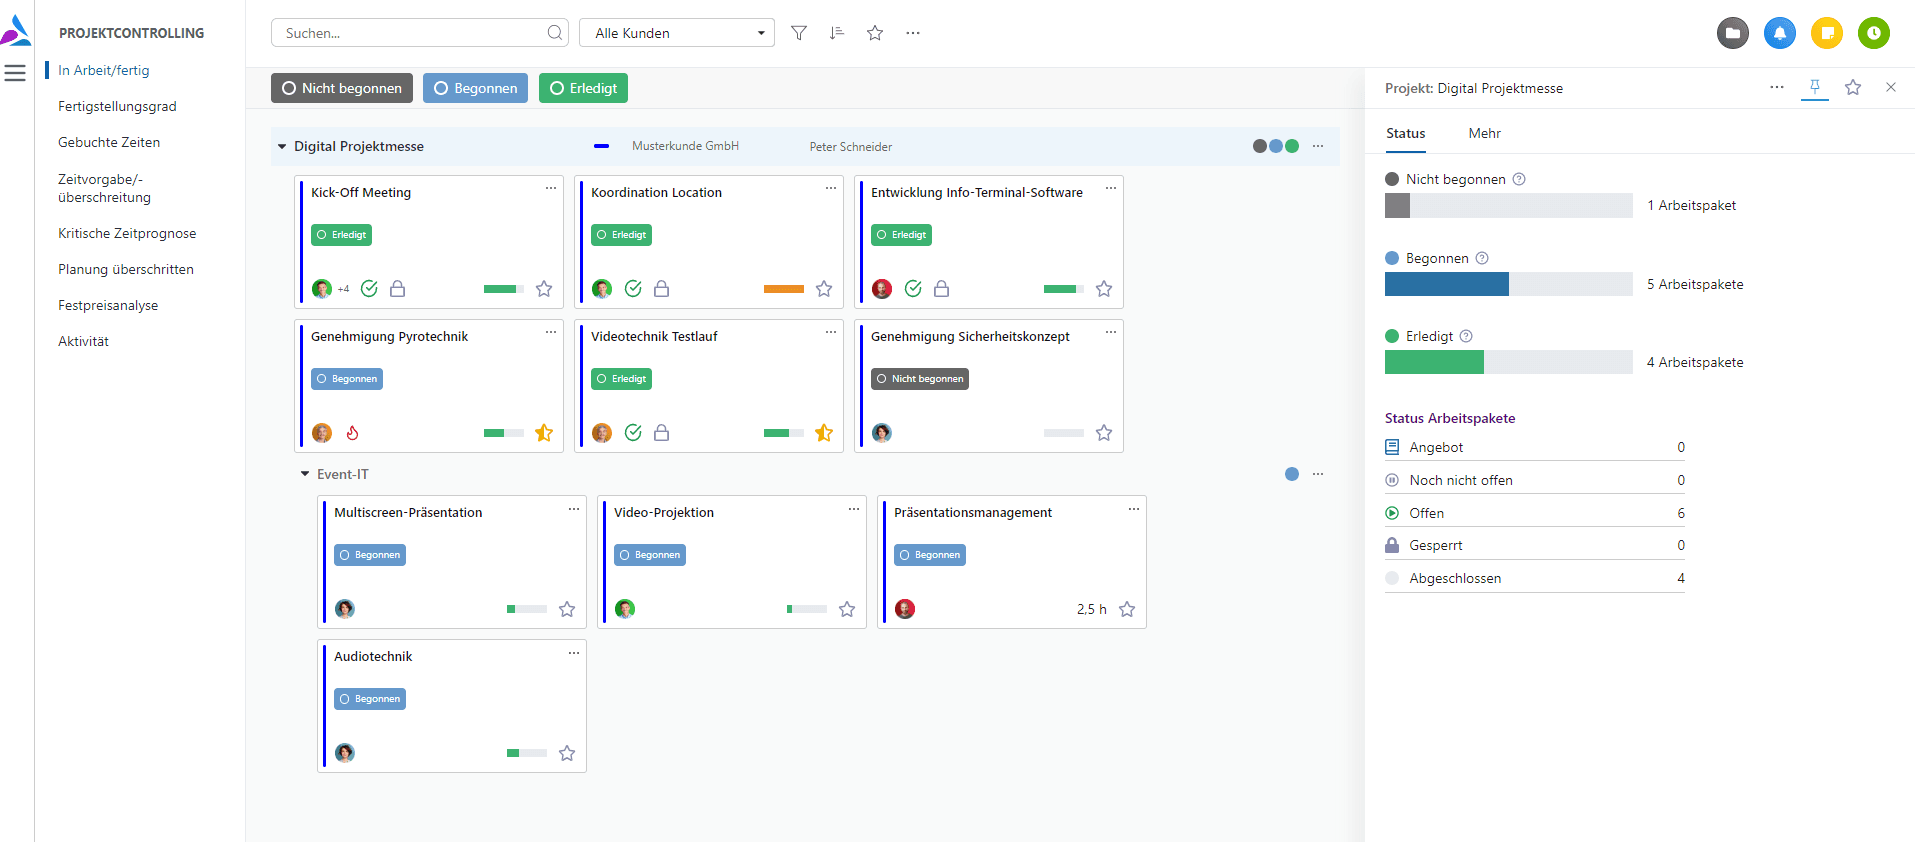
Percentage of completion
The question about the degree of completion is certainly one of the most interesting questions in the field of project management. Calculating a reliable POC is often a challenge. As a rule, determining a reliable POC requires a considerable amount of time and effort, with meticulous tracking and frequent follow-up with project participants.
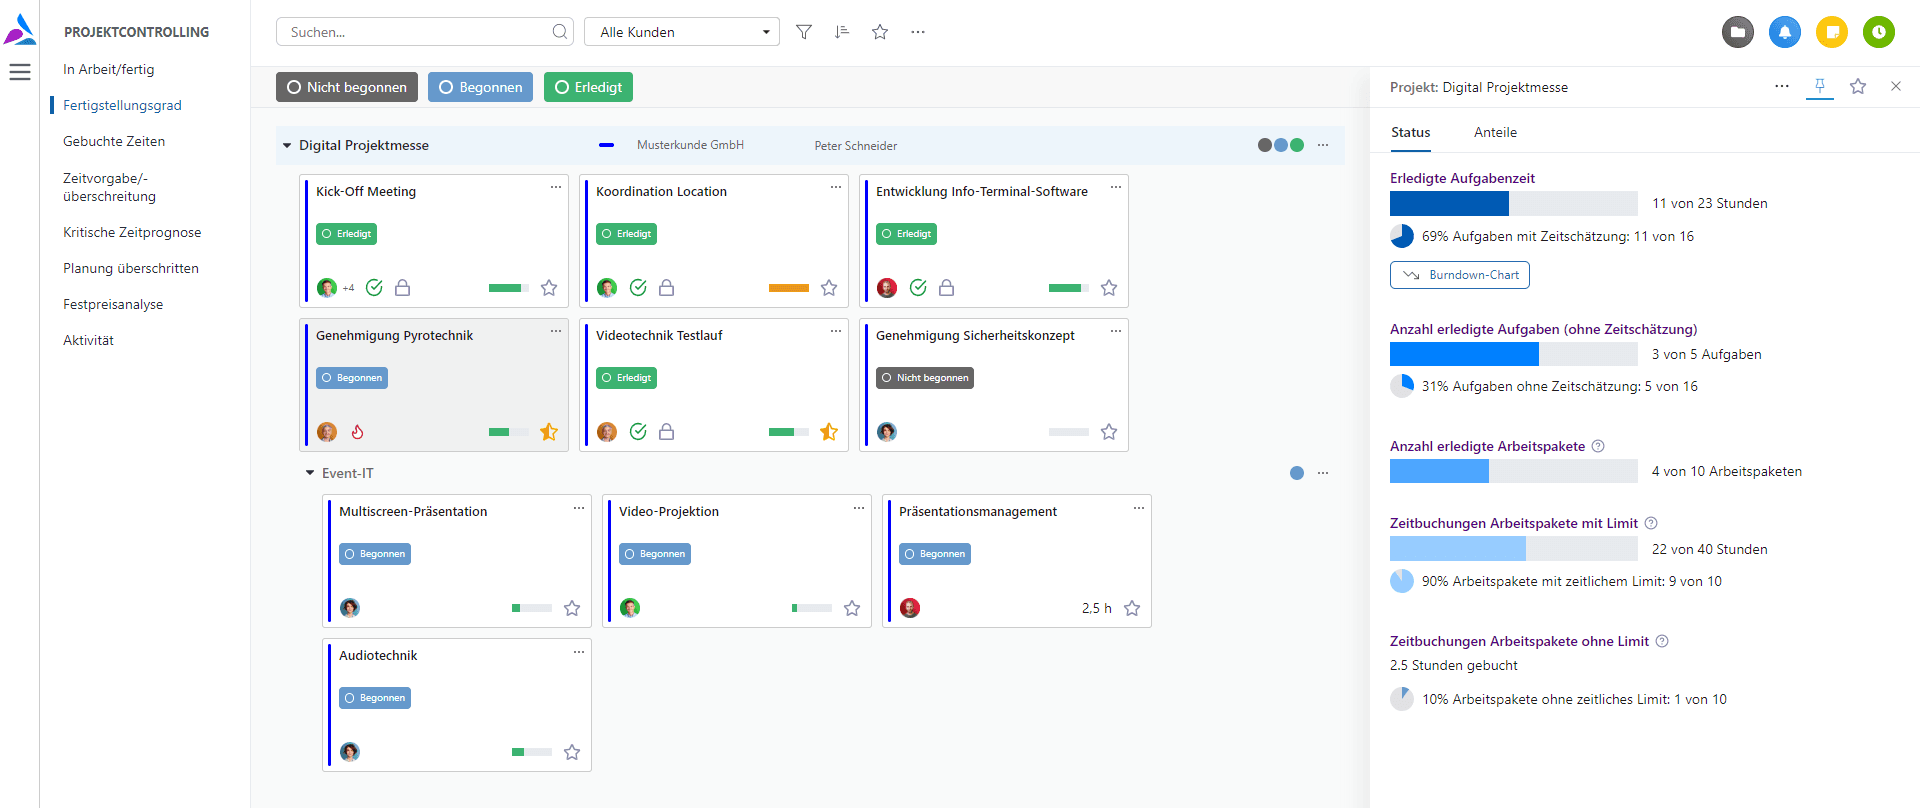
In addition, different work methods are often mixed in a project, further complicating the calculation of the percentage of completion.
Octaved Flow offers an alternative, lean and efficient approach based on two core ideas. The first idea is called task time in Octaved Flow, but there is actually an organizing principle behind it.
Organization with work packages and tasks
In the complexity of today's project world, it is impossible for the project manager to know all the details of all the work packages in a project. "Micro-management," or the oversight of even the smallest details by those responsible, has rightly long ceased to be a sign of good team leadership.
Today, project managers provide the framework, but they are dependent on leaving the precise details to the executors. They are usually in a better position to judge the details.
In Octaved Flow, this working method is illustrated as follows: Project managers divide the project into work packages. These work packages are given an estimated or maximum effort by the project manager, are planned and assigned to executors.
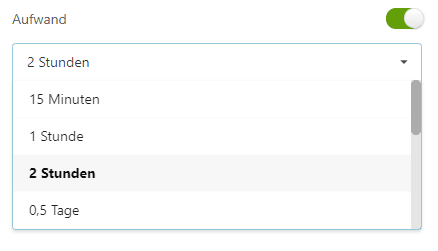
Die Ausführenden unterteilen ein Arbeitspaket dann in Aufgaben, die sie zu Beginn der Umsetzung erstellen und die am Schluss als Checkliste dienen. Idealerweise geben die Ausführenden den Aufgaben dabei einen geschätzten Aufwand. Es ist für die Ausführenden viel leichter die Zeit im Griff zu behalten, wenn sie ein Arbeitspaket mit einem geplanten Aufwand von 40 Stunden in 20 Aufgaben von je 2 Stunden unterteilen. Wir sind alle Menschen und bei 40 Stunden glauben wir noch sehr viel Zeit zu haben. Geht man Aufgabe für Aufgabe vor, merkt man viel früher, wenn etwas aus dem Ruder zu laufen droht.
Hinweis:
Natürlich gibt es immer Projektmitarbeiter, die auf die Planung durch Teamleiter, Lead-Developer oder Projektmanager angewiesen sind, weil ihnen die Erfahrung fehlt. Das beeinflusst das Verfahren aber nicht. Denn es spielt keine Rolle, wer die Schätzung vornimmt. Wichtig ist die Unterteilung in überschaubare, vom jeweiligen Aufwand her eher klein gehaltene Aufgaben.
Zeitintervalle wie 15 Minuten, 1 Stunde, 2 Stunden und ein halber Tag haben sich in der Praxis bewährt und verbessern die Qualität von Analysen und Prognosen signifikant.
To reliably determine project progress, Octaved Flow goes back up the ladder that has been descended from project to work package to task and looks at all tasks in all work packages of a project.
If, for example, there are 600 task hours in total for the project and 300 of them are included in completed tasks, it can be quite reliably assumed that the project is 50% complete. If 300 task hours are posted to the project, this can mean all or nothing.
Task time is placed at the top in Octaved Flow because it is the most informative due to its fine granularity.
For this, a pie chart shows how many of the tasks have a time estimate. If many tasks have a duration statement, the number is more meaningful.

The second idea is to arrange information in descending order in the level of detail and reliability and leave the assessment to the project manager how to interpret the metrics in the specific case. In other words, Octaved Flow provides the basis for decision-making, the assessment is up to the project manager.
In descending order, next comes the percentage of completed tasks that have no time estimate. The accuracy of this value is lower, because behind tasks there can be very different efforts.

Then the number of completed work packages is displayed. This is a reliable source of information, for example, in projects with many work packages that are roughly homogeneous in terms of effort.

Next come the time bookings of the performers on work packages that have an effort limit. This figure is usually again somewhat less precise than the one above it. For example, the time limit could be 90% exhausted by time bookings, even though the work package is only 10% complete. Depending on the type of project and the team, however, the fact that 20 out of 40 hours are booked on a work package may well be equated with 50% completion.

At the end, and therefore at the bottom of the page, are the time bookings on work packages with no effort limit. A more experienced project manager, who knows the subject and can estimate the executor, has at least an approximate point of reference here, even without further information.

Booked times
In this menu item time bookings are analyzed. Project work times are basically booked to work packages in Octaved Flow. Since work packages belong to sub-projects and these in turn to projects, booked times are consolidated to the next higher level.
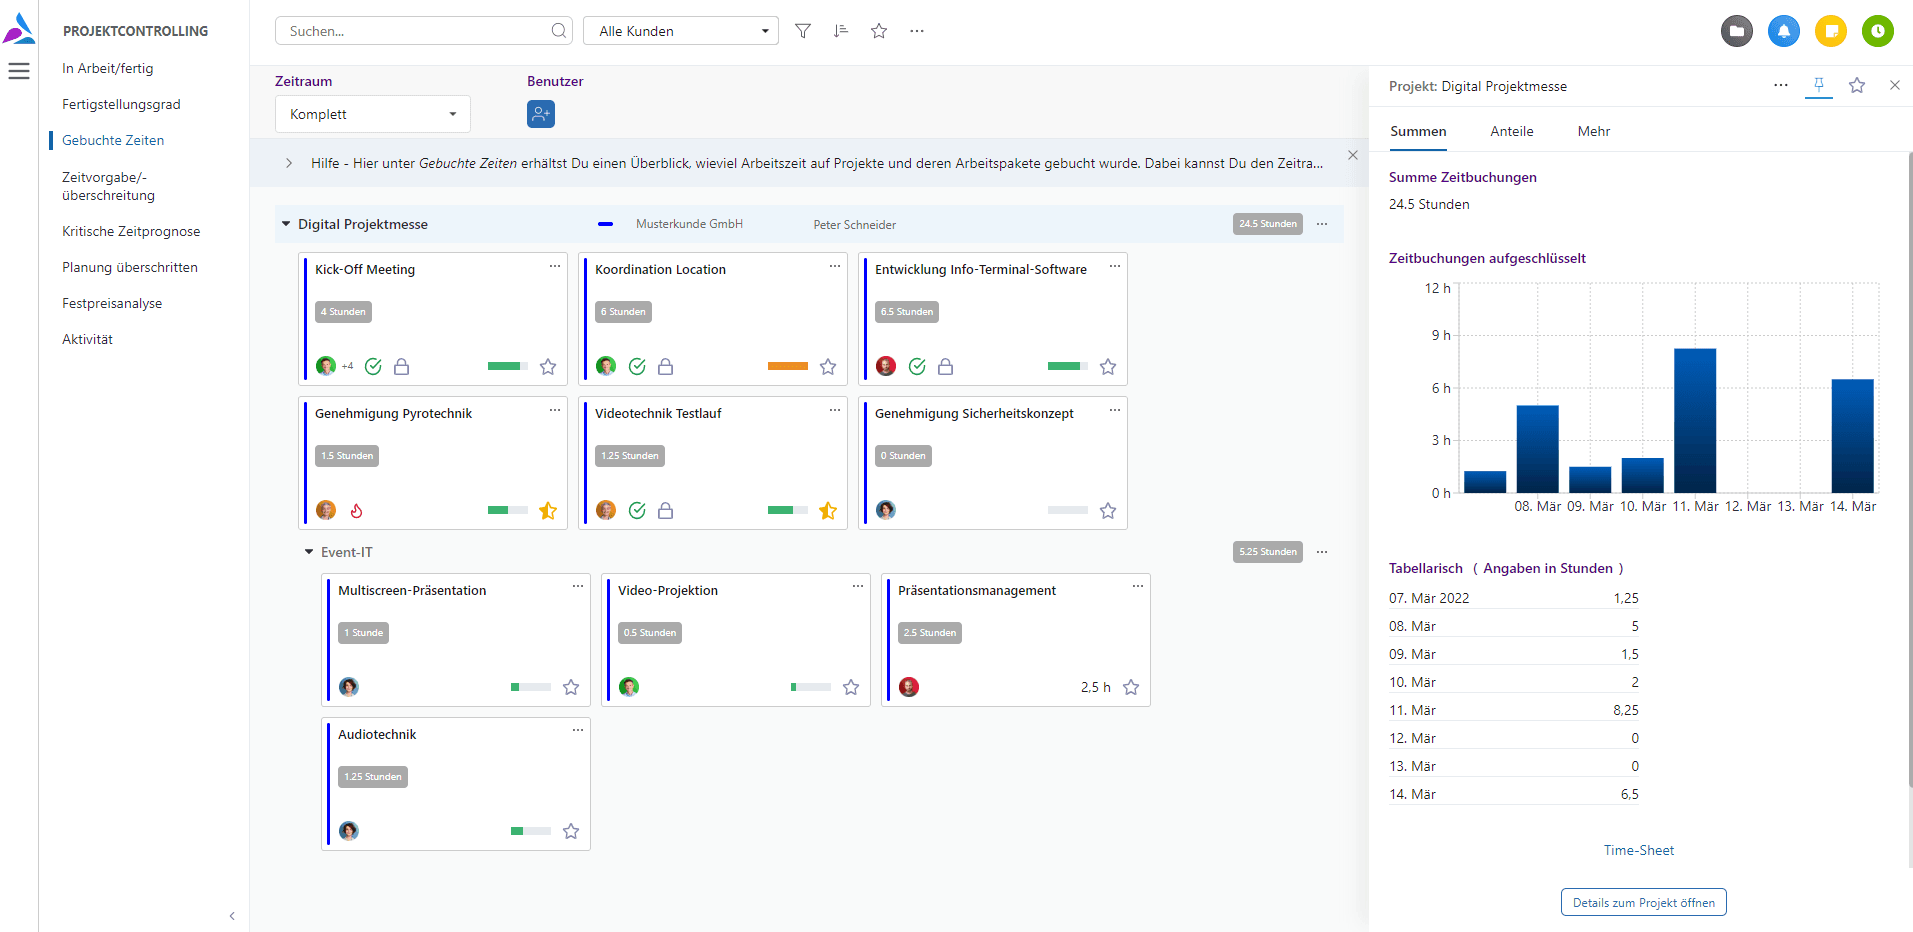
In customer projects and projects with time specifications, it is more relevant to consider the percentage of the specified time that has already been used than the pure time booking totals. However, it is not uncommon for internal projects, for example, to be carried out without time specifications. In this case, the booked times are the first point of contact.
Evaluation possibilities for booked times also result from other aspects.
In Octaved Flow a project can receive a time specification and work packages can receive an individual time specification or not. If the Timing is enabled at the project level for a project, it will be displayed first.
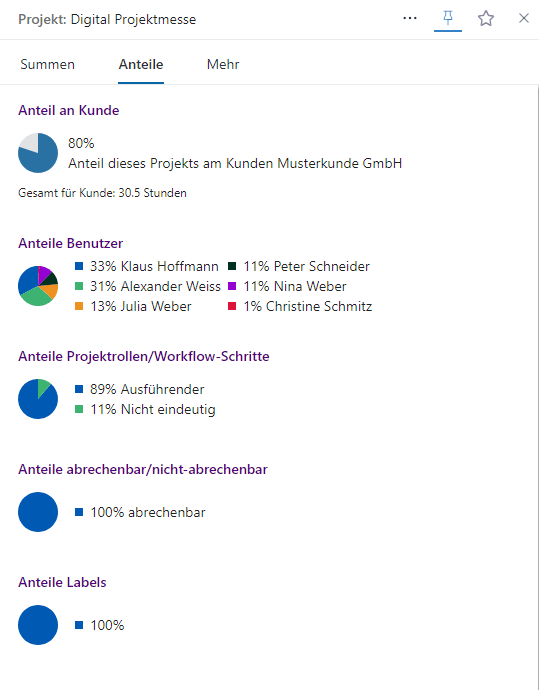
The first pie chart under Shares shows the share of this project in all currently running projects for the same customer. If a work package is selected, the share of time bookings for this work package in the total time bookings of the project is displayed in the same place.
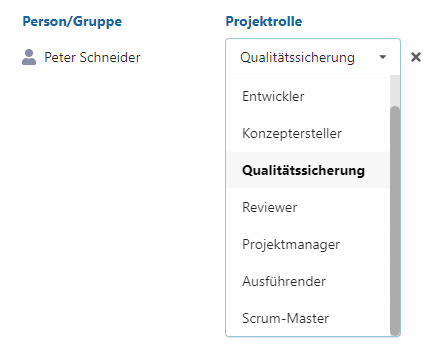
Several executors can work in different project roles on one work package, for example in the roles "Executor" and "Quality Assurance". The project roles can be freely configured. The third pie chart shows the distribution of the booked times into the project roles occurring in the project or work package.
In a project, there may be work packages that are not billable. For example, the acquisition of a customer project cannot normally be billed, nor can warranty services. However, it makes sense to include these work packages in the project. The fourth pie chart shows the rate of non-billable work time, allowing you to view and compare the profitability of projects.
You can freely configure labels in Octaved Flow. Labels can be assigned anywhere, even in time entries. A typical use case is to book meetings with a label "Meeting". The distribution by labels is shown here and also allows comparisons between different projects and different customers.
Time limit/exceedance
Time constraints usually play a major role in customer projects, especially if services with a time cap or fixed prices have been agreed with the customer. Since working time is at least a large or even the largest cost factor, adherence to time targets is essential for profitability. Internal projects can also be provided with time constraints, for example to be able to contain a spillover at an early stage.
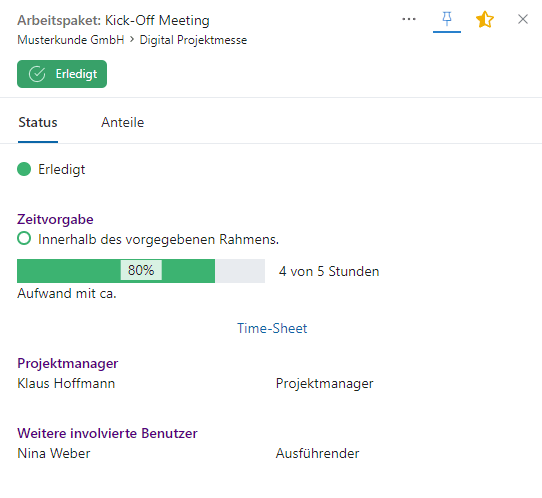
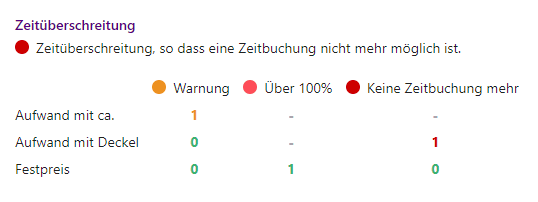
In this menu item of Octaved Flow, bars show the ratio of booked project working times to planned efforts. With a traffic light system you can identify problems at a glance.
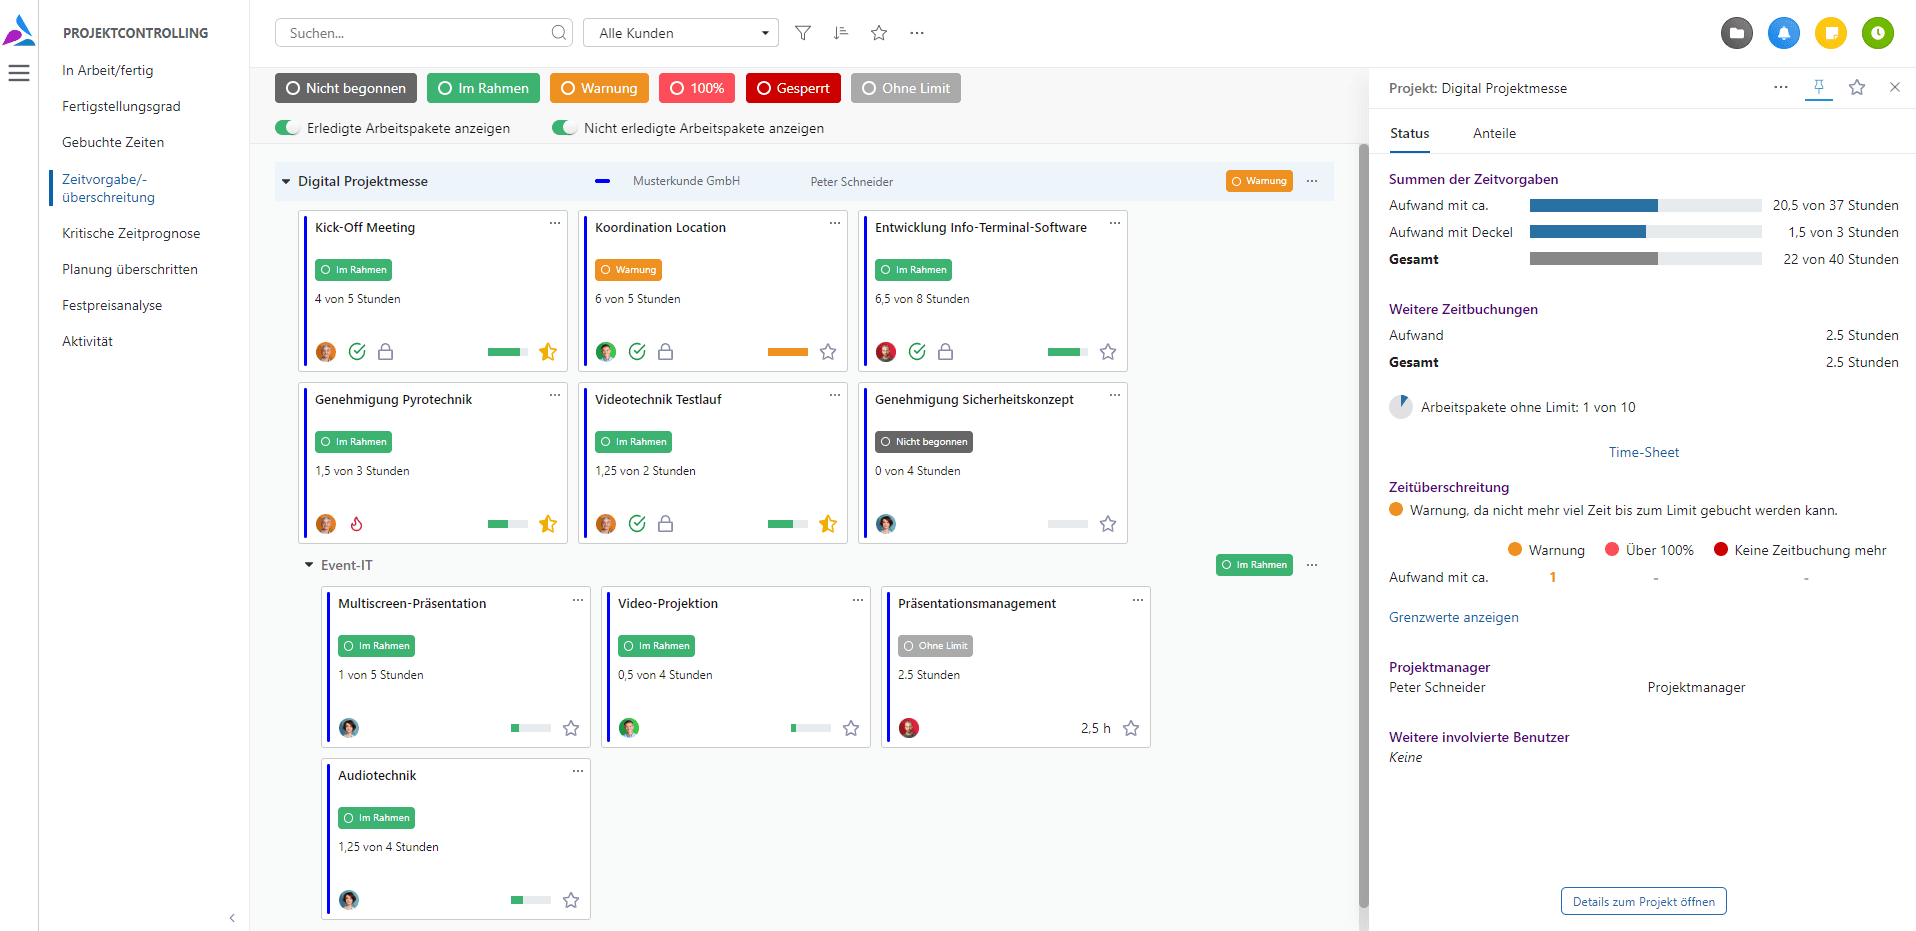
The sum of the time targets for a billing/time target type combines all work packages that have this billing/time target type, for example all with effort with cap to one bar.
For example, if three work packages each have 10 hours of effort as a cap and a total of 15 hours are booked on the three work packages, the corresponding bar is at 50%. However, it is possible that the first work package with 11 hours is already in the overbooking reserve, while the third has not yet been booked. This and similar cases are then shown via the traffic light system. The meaning of the colors becomes clear via the filters.
If there is a red work package (or several) in a project, the project becomes red. By expanding you get to the sub-project and then to the causing work package.
Critical time forecast
Task time is used in the critical time forecast. Task time is described above under Performance Rate.
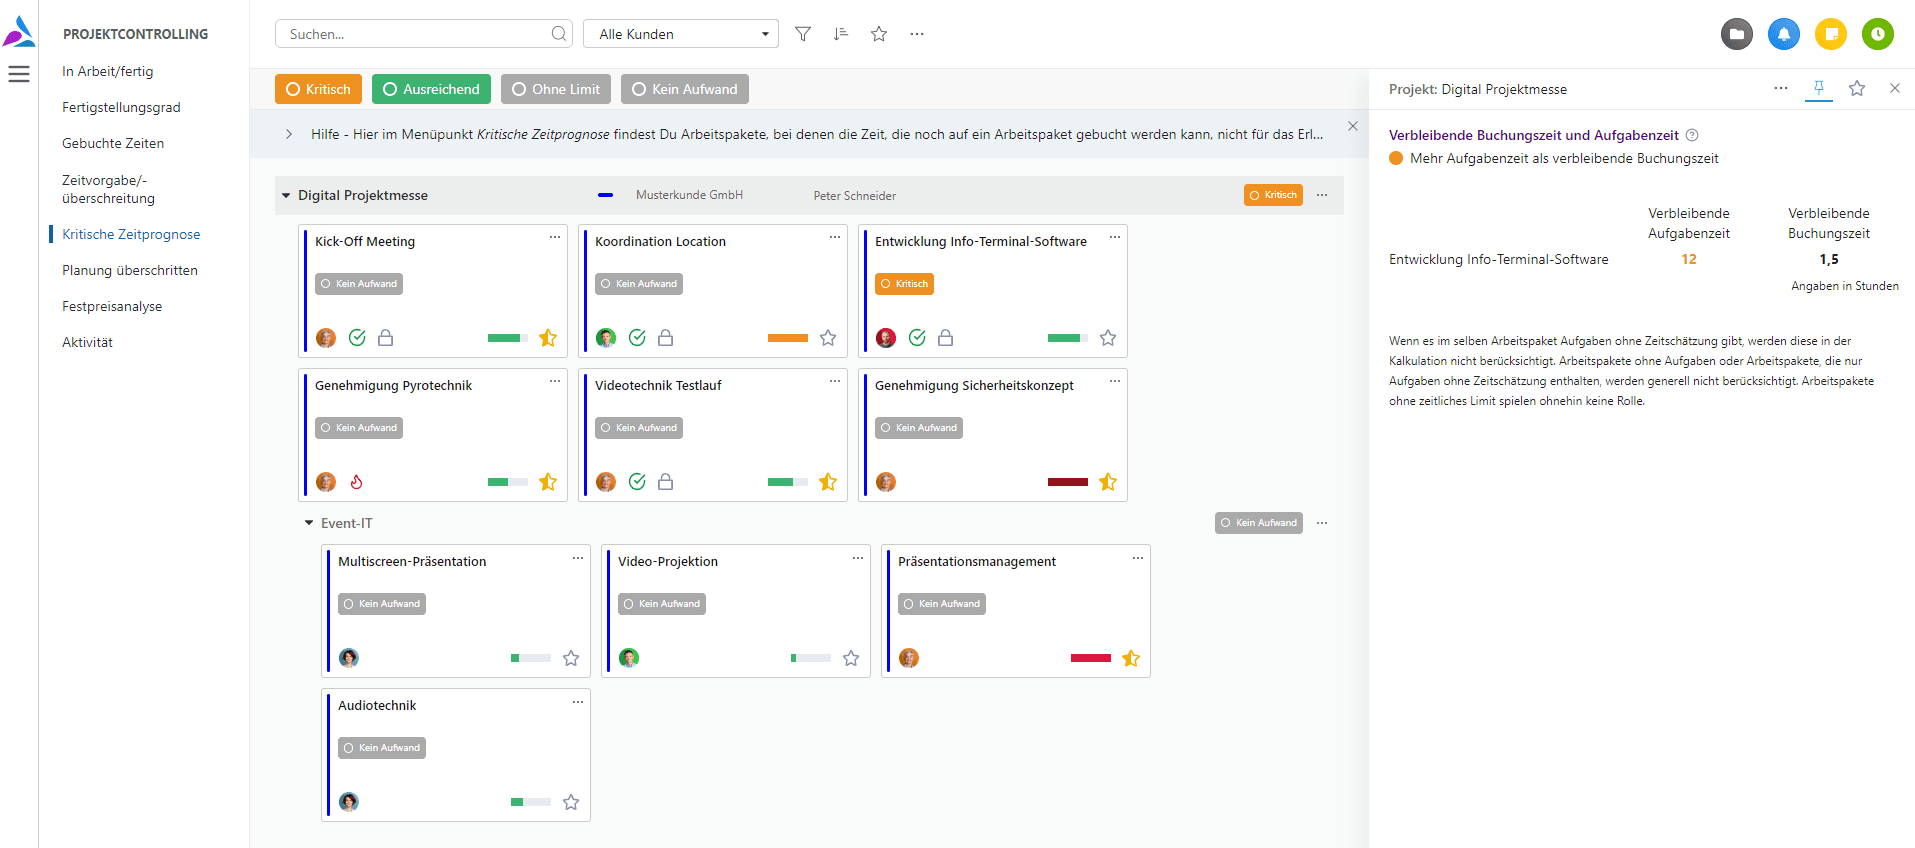
The time forecast is critical if the sum of the estimated effort of the tasks that still need to be completed is greater than the remaining time that can be posted. In other words, this work package will most likely not be completed without exceeding the limit.
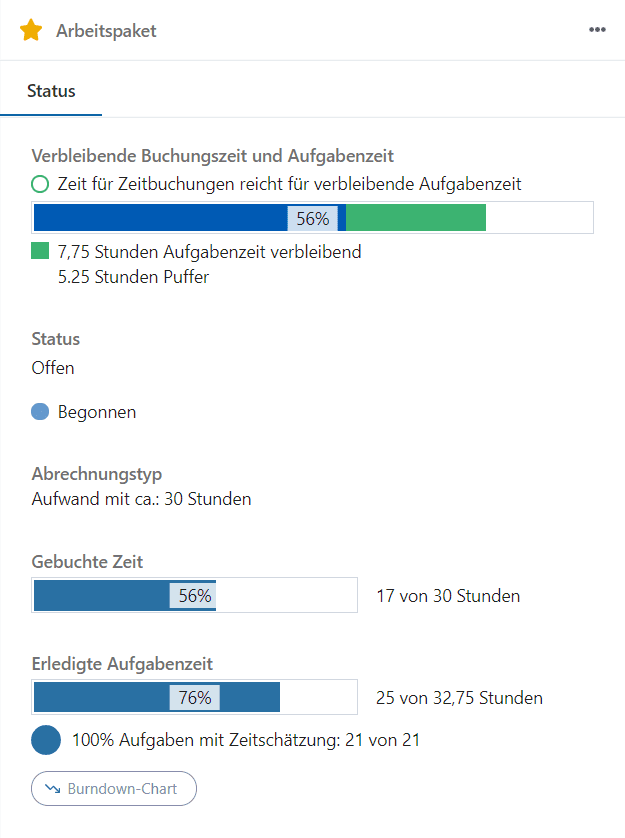
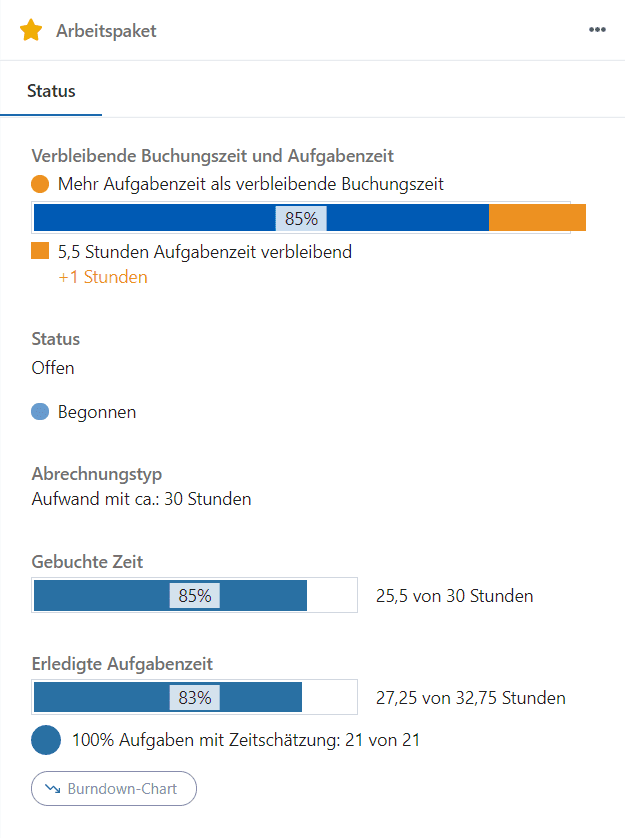
The economic aspect is primarily taken into account here. In other words, it is not a question of whether the project will be completed on time/by the planned due date, but whether the specified budget will be adhered to.
Planning exceeded
You can specify a due date in Octaved Flow for projects and sub-projects. Work packages are scheduled with a (start and) end date.

If a work package is not marked as completed by the planned end date, it will be displayed in red here. The end of the day is always relevant. For example, if the end date of the work package is planned for October 1, it is sufficient if it is completed on October 1 at 23:59.
For projects and sub-projects, the due date is considered to be held if all contained work packages have been marked as done by that time.
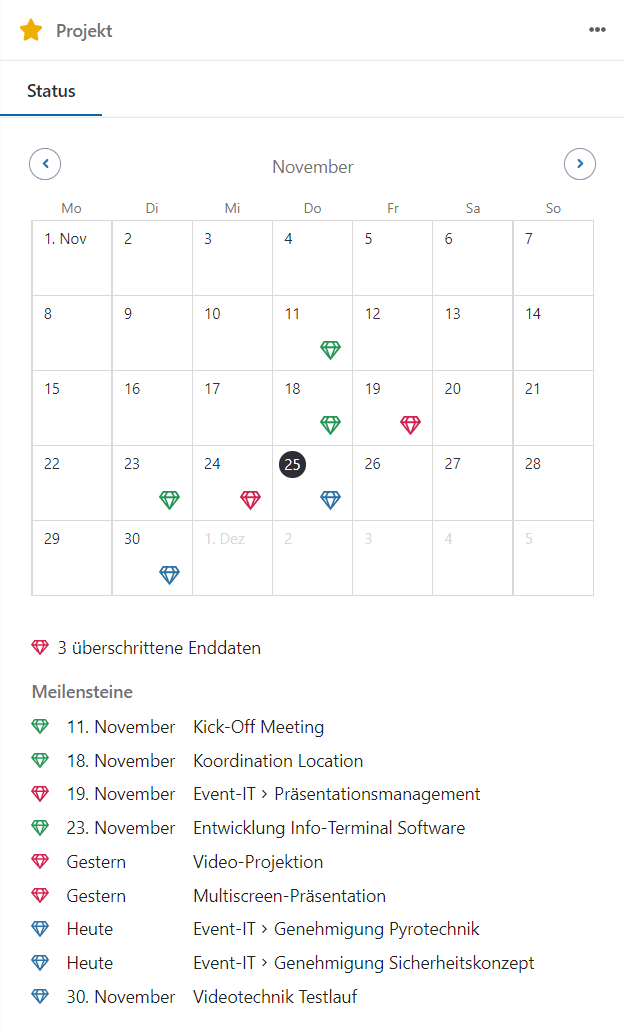
The color codes are:
- Red - Due date or end date exceeded
- Blue - Due date or end date not yet reached, still in progress
- Green - Marked as done
When something was completed does not matter. So the color green will be displayed, regardless of whether it was red or blue before. This is not a retrospective, but an actual state.
Tasks are the responsibility of the executors and are not shown here. Performers will see tasks that have not been completed in a timely manner in red in their workspace.
Fixed price analysis
If fixed prices are agreed with the customer for one or more work packages, a specific hourly rate is usually used for the calculation.
For example, let's assume that 8 hours of effort were calculated for a work package, 2 hours were added as a reserve, and an hourly rate of 100 euros was applied. The fixed price of the work package is therefore 1,000 euros.
If the work package is actually completed in 8 working hours, there are two ways of looking at it. The first is that 2 working hours corresponding to 200 euros have been realized as (additional) profit. Another way of looking at it is the imputed hourly rate. In the example, a turnover of 1,000 euros is achieved with 8 working hours, which corresponds to an imputed hourly rate of 125 euros. Thus, instead of the originally planned 100 euros hourly rate, 125 euros are achieved.
If, on the other hand, 12 working hours were necessary, one way of looking at it is that the two hours reserve are used up and an additional two hours are "in the red" with 100 euros each. With the other way of looking at it, the result is that the imputed hourly rate is 83.33 euros.
Normally, entrepreneurs know at least approximately the average cost of an hour of work. Of course, every hour spent on a fixed-price project that is avoidable is a loss. But just when the red line of internal costs is threatened to be undercut, further levers are probably set in motion.
In Octaved Flow, the imputed hourly rate is used to look at the profitability of time-capped work packages. This is easy to follow principle that allows maximum comparability.
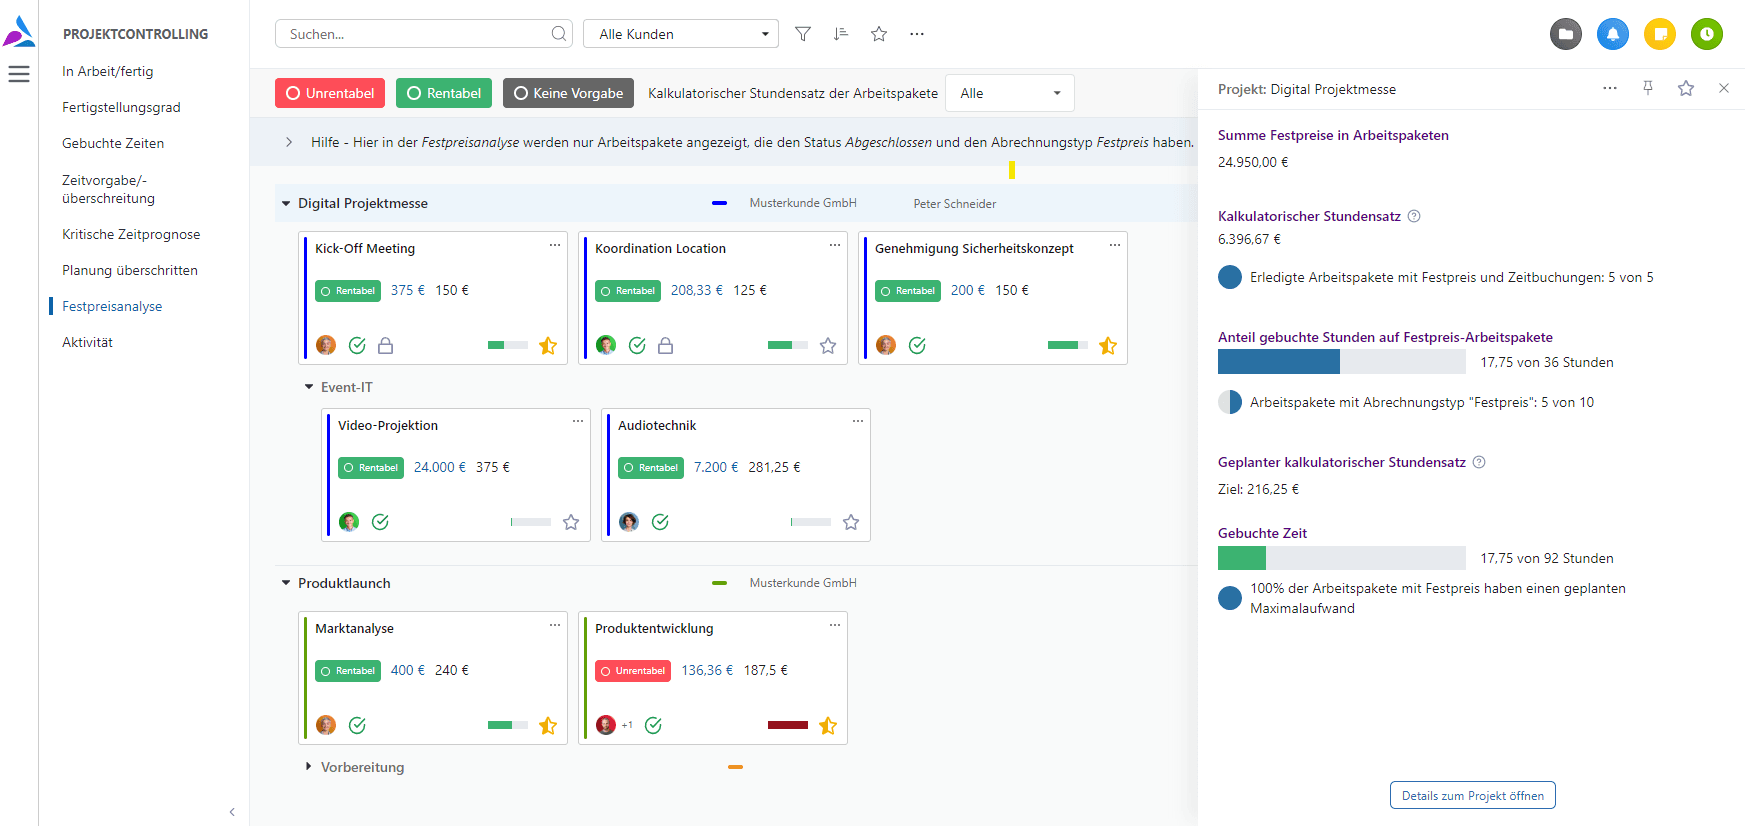
If all work services including customer acquisition are booked, customers can be fully compared with the imputed hourly rate. Of course, you can also apply this to projects, sub-projects or company divisions.
Activity
In the menu item Activity, projects are displayed that are active or not active in a period of time. If there are no time bookings for a while, no tasks or work packages are done and there are no posts in the wiki, the project is not active.
You can display all projects in which there has been activity since a time to be specified in the past up to the current time. Or, you can display all projects in which there has been no activity since a time in the past up to the current time. In other words, these are projects that were last active before the time you selected.
The second option can be used, for example, to identify projects that are just "file corpses" and should really be closed, whose billing has been forgotten, or which should be reactivated.
Filters
All menu items have so called Quick-Filters directly above the project area (in the middle), which allow a quick filtering depending on the context. Behind the filter icon are further filters, which are basically the same for all menu items, but slightly adjusted depending on the context.
For example, if sums of work packages are displayed in a project, the filtering is taken into account. Only those work packages are used for the calculation of the sum that are not hidden by the filtering. A corresponding note is displayed and the filter icon has a different color.
Authorizations for time bookings of users
In most statistics, the sum of time bookings for a single work package is used. To see this, the user role Reader or a higher user role is required. Elsewhere in Octaved Flow, the progress bar showing how much time has been used up is also displayed for all users with user role Reader. This bar also contains the sum of the times booked on the work package.
In the menu item Posted times in the project controlling there are filters according to user and period. Therefore, the project role Manager is required here to be able to see the user statistics and use the quick filters by user and period that are in the header above the project tree.
Whenever a reference can be made from individual time bookings to the person making the booking, either the Manager project role is required, or the Reader project role if Time Bookings is set to "All users may see all time bookings" in the permissions under System Settings.
If these permissions are missing, time bookings are only displayed anonymously, i.e. without the name of the person making the booking. In addition, user statistics and user filters, for example in the menu item Booked times, are hidden.
If the permission settings for time bookings are set to "Only assigned users are allowed to see time bookings" (matrix), applicable time bookings can still be displayed with the person's name. However, filters and statistics remain hidden.